Biggest headlines by paper

This is a notebook that looks at the biggest headlines for newspapers over the last half-year, mainly for ten newspapers we particularly care about. It also looks at some interesting aspects of the largest headlines across all the papers.


In [159]:
from jupyter_cms.loader import load_notebook

eda = load_notebook('./data_exploration.ipynb')

df, newspapers = eda.load_data()

Major newspaper headlines

These slugs were chosen from the Wikipedia page of widely circulated newspapers in the United States: https://en.wikipedia.org/wiki/List_of_newspapers_in_the_United_States#By_circulation. Unfortunately it seems like that list was using 2013 data, but I recognize enough of these papers as major that it's a close-enough approximation.

Also we have to leave the NYT and New York Post out, unfortunately, since pdfminer extracted their characters without being able to group them into lines and paragraphs. If taking character-level data and massaging it into paragraphs sounds like a fun task for you, please drop a Github issue or otherwise get in touch :)


In [177]:
slugs_of_interest = [
    'WSJ',
    'USAT',
    'CA_LAT',
    'CA_MN',
    'NY_DN',
    'DC_WP',
    'IL_CST',
    'CO_DP',
    'IL_CT',
    'TX_DMN'
]

In [160]:
import pandas as pd
from datetime import datetime

pd.set_option('display.max_columns', 100)

df.head(2)


Out[160]:
text fontface fontsize bbox_left bbox_bottom bbox_right bbox_top bbox_area avg_character_area percent_of_page page page_width page_height page_area date day_of_week weekend slug id page_height_round page_width_round page_width_round_10 page_height_round_10 aspect_ratio
948 GET YOUR TICKETS! SalvoSansExtraCond-Black 28.665 197.963 1413.262 352.508 1441.927 4430.032425 262.598379 0.004117 1 729.0 1476.0 1076004.0 2017-12-04 0 False AL_TN 949 1476 729 720 1470 0.5
949 Styx is returning to the \nTuscaloosa Amphithe... SalvoSans-Bold 14.250 197.963 1352.900 338.523 1411.150 8187.620000 76.041081 0.007609 1 729.0 1476.0 1076004.0 2017-12-04 0 False AL_TN 950 1476 729 720 1470 0.5

In [165]:
df['month'] = df['date'].apply(lambda x: x.month)

In [226]:
def print_row(i, row):
    print("#{i}: {title} — {date:%b. %-d} — {fontsize:.2f}pt".format(
        i=i + 1,
        title=" ".join(row.text.split()),
        date=row.date,
        fontsize=row.fontsize))
    
def largest_font_headlines(npdf, paper):
    npdf = npdf[(npdf.bbox_top > npdf.page_height / 2) & (npdf.month >= 6)]
    top = npdf.sort_values(by='fontsize', ascending=False).head(10)
    print(paper)
    for i, (_, row) in enumerate(top.iterrows()):
        print_row(i, row)

In [227]:
# Um, definitely should have a better place for doing this, but on Dec 18th the WSJ PDF I archived was actually
# a different newspaper, somehow. I wonder if it's a Newseum error, but they don't keep their archives up beyond a day

largest_font_headlines(df[(df.slug == 'WSJ') & (df.date != datetime(2017, 12, 18))], 'The Wall Street Journal')

print()

largest_font_headlines(df[df.slug == 'USAT'], 'USA Today')

print()

largest_font_headlines(df[df.slug == 'CA_LAT'], 'Los Angeles Times')

print()

largest_font_headlines(df[df.slug == 'CA_MN'], 'San Jose Mercury News')

print()

largest_font_headlines(df[df.slug == 'NY_DN'], 'New York Daily News')

print()

largest_font_headlines(df[df.slug == 'DC_WP'], 'The Washington Post')

print()

largest_font_headlines(df[df.slug == 'IL_CST'], 'Chicago Sun Times')

print()

largest_font_headlines(df[df.slug == 'CO_DP'], 'The Denver Post')

print()

largest_font_headlines(df[df.slug == 'IL_CT'], 'Chicago Tribune')

print()

largest_font_headlines(df[df.slug == 'TX_DMN'], 'The Dallas Morning News')


The Wall Street Journal
#1: ‘It Was Just a Kill Box’ — Oct. 3 — 72.30pt
#2: Terror Strikes Barcelona — Aug. 18 — 67.36pt
#3: Terror Rampage in New York — Nov. 1 — 67.36pt
#4: Rain, Floods Deluge Texas — Aug. 28 — 67.36pt
#5: Battle Lines Drawn on Health Care — Jun. 23 — 56.15pt
#6: Trump Threatens to End Iran Deal — Oct. 14 — 56.15pt
#7: Hiring Growth Powers Economy — Dec. 9 — 56.15pt
#8: Senate Passes Budget Plan — Oct. 20 — 56.15pt
#9: Franken Bows to Pressure — Dec. 8 — 56.15pt
#10: Bankers Uneasy on Inflation — Oct. 16 — 56.15pt

USA Today
#1: CATASTROPHE — Aug. 28 — 128.94pt
#2: 09.20.17 THE WALL — Sep. 20 — 127.71pt
#3: ‘A COWARDLY ACT’ — Nov. 1 — 109.48pt
#4: ‘AN ACT OF PURE EVIL’ — Oct. 3 — 104.64pt
#5: Gunman kills 26 at church service — Nov. 6 — 88.06pt
#6: HARVEY COULD DRIVE 30,000 TO SHELTERS — Aug. 29 — 81.61pt
#7: Agony builds as water rises — Aug. 30 — 81.61pt
#8: TRUMP SAYS IT PLAINLY: ‘WE’RE GETTING OUT’ — Jun. 2 — 79.38pt
#9: Transgender troops in limbo — Jul. 27 — 78.26pt
#10: Nowhere to hide — Sep. 11 — 78.26pt

Los Angeles Times
#1: THIS TEAM! — Oct. 20 — 168.56pt
#2: ‘Like a blowtorch’ — Oct. 11 — 109.99pt
#3: A CITY PUMMELED — Aug. 28 — 106.40pt
#4: MEXICO JOLTED BY A DEADLY 7.1 QUAKE — Sep. 20 — 104.01pt
#5: MAYHEM IN VEGAS: ‘LIKE A WAR ZONE’ — Oct. 3 — 100.43pt
#6: Santa Anas subside, but not fires’ threat — Dec. 9 — 98.04pt
#7: ‘It’s just too hot’ — Jun. 21 — 98.03pt
#8: Republican tax plan headed to president — Dec. 20 — 98.03pt
#9: Disney’s power play — Dec. 15 — 98.03pt
#10: TERROR IN LONDON — Jun. 4 — 95.40pt

San Jose Mercury News
#1: M e T o o — Oct. 22 — 209.67pt
#2: HOPE AMID THE ASHES — Nov. 12 — 125.42pt
#3: TECH’S DIRTY LITTLE SECRET — Jul. 9 — 122.21pt
#4: IRMA — ‘REALITY HAS SETTLED IN’ — Sep. 11 — 117.92pt
#5: THE BIG REVEAL — Sep. 10 — 117.92pt
#6: TOTALLY COOL — Aug. 22 — 114.70pt
#7: FLAMES THREATEN NEW TOWNS; DEATHS RISE — Oct. 12 — 113.63pt
#8: CONTAINMENT IN SIGHT — Oct. 16 — 108.27pt
#9: FIREFIGHTERS SAY — Oct. 16 — 108.27pt
#10: MASSACRE ON THE STRIPWHY DID VEGAS GUNMAN MOW DOWN INNOCENTS? — Oct. 3 — 107.20pt

New York Daily News
#1: ALL EVEN — Oct. 10 — 329.54pt
#2: POISON BILL — Nov. 19 — 303.97pt
#3: pure joy — Oct. 12 — 301.81pt
#4: SPOrtSHIM AGAIN — Nov. 8 — 297.68pt
#5: gone girl — Nov. 9 — 294.65pt
#6: BURN IN HELL — Nov. 20 — 292.10pt
#7: sick mind — Sep. 22 — 290.02pt
#8: one to go! — Oct. 19 — 287.91pt
#9: cluck kent — Oct. 28 — 281.41pt
#10: ART STEAL — Dec. 20 — 274.90pt

The Washington Post
#1: 59 die in Las Vegas attack — Oct. 3 — 104.85pt
#2: Irma strafes Florida coast — Sep. 11 — 75.72pt
#3: 3 Trump campaign o∞cials charged — Oct. 31 — 74.56pt
#4: Grave dangers in Harvey’s wake — Sep. 1 — 69.90pt
#5: Jones wins in Democratic upset — Dec. 13 — 69.90pt
#6: Attackers strike London — Jun. 4 — 69.90pt
#7: Terror strikes Barcelona — Aug. 18 — 69.90pt
#8: Victory for Northam in Va. — Nov. 8 — 69.90pt
#9: NYC truck attack kills 8 — Nov. 1 — 69.90pt
#10: Ivanka Inc. — Jul. 16 — 69.90pt

Chicago Sun Times
#1: THAT’S WON! — Oct. 16 — 306.84pt
#2: FAKE — Aug. 16 — 299.68pt
#3: ‘LOVE’ — Jul. 12 — 258.35pt
#4: OT BLUES — Oct. 4 — 257.50pt
#5: SODA FLOP — Oct. 7 — 257.50pt
#6: UNSAFE ATHOME — Sep. 2 — 251.98pt
#7: COLD — Jun. 2 — 248.75pt
#8: POPCULTURE — Jul. 24 — 246.12pt
#9: HE’S BAAACK — Nov. 21 — 241.35pt
#10: QUINNIN! — Oct. 28 — 241.34pt

The Denver Post
#1: eclipse — Aug. 21 — 141.73pt
#2: “ACT OF EVIL” — Nov. 6 — 124.52pt
#3: Grief, confusion — Oct. 3 — 118.52pt
#4: At a net loss — Sep. 10 — 116.60pt
#5: Oil in Colorado’s political machine — Jul. 16 — 109.80pt
#6: GAME ON — Oct. 21 — 107.14pt
#7: Deal lands at $1.8B — Jul. 20 — 106.41pt
#8: DESERT DRAMA — Jun. 25 — 104.90pt
#9: Immediately in peril — Jun. 23 — 99.62pt
#10: Out of the deal — Jun. 2 — 99.62pt

Chicago Tribune
#1: ‘ACTOFPUREEVIL’ — Oct. 3 — 125.40pt
#2: Out at home — Oct. 20 — 117.60pt
#3: UNSCRIPTED — Aug. 16 — 110.40pt
#4: TRUMP — Aug. 16 — 110.40pt
#5: Trump’s victory lap — Dec. 21 — 108.90pt
#6: BRYZZNESS IS BOOMING — Oct. 7 — 102.30pt
#7: Florida dealt a blow — Sep. 11 — 97.20pt
#8: FUROR PROMPTS REBUKE — Aug. 15 — 96.80pt
#9: TRUMP ENDS DACA — Sep. 6 — 94.80pt
#10: Down to the wire — Oct. 13 — 94.80pt

The Dallas Morning News
#1: ‘Horrifi c tragedy’ — Nov. 6 — 134.74pt
#2: Moments in history — Jul. 7 — 129.98pt
#3: Only the start — Aug. 27 — 116.99pt
#4: Devastating deluge — Aug. 28 — 113.46pt
#5: Starting to dig out — Sep. 1 — 113.46pt
#6: Helping hands — Aug. 29 — 113.46pt
#7: American carnage — Oct. 3 — 108.73pt
#8: Harvey slams ashore — Aug. 26 — 107.52pt
#9: 3 dead after racial clashes in Virginia — Aug. 13 — 106.40pt
#10: Irma jukes, jabs — Sep. 10 — 106.36pt

Other analyses!

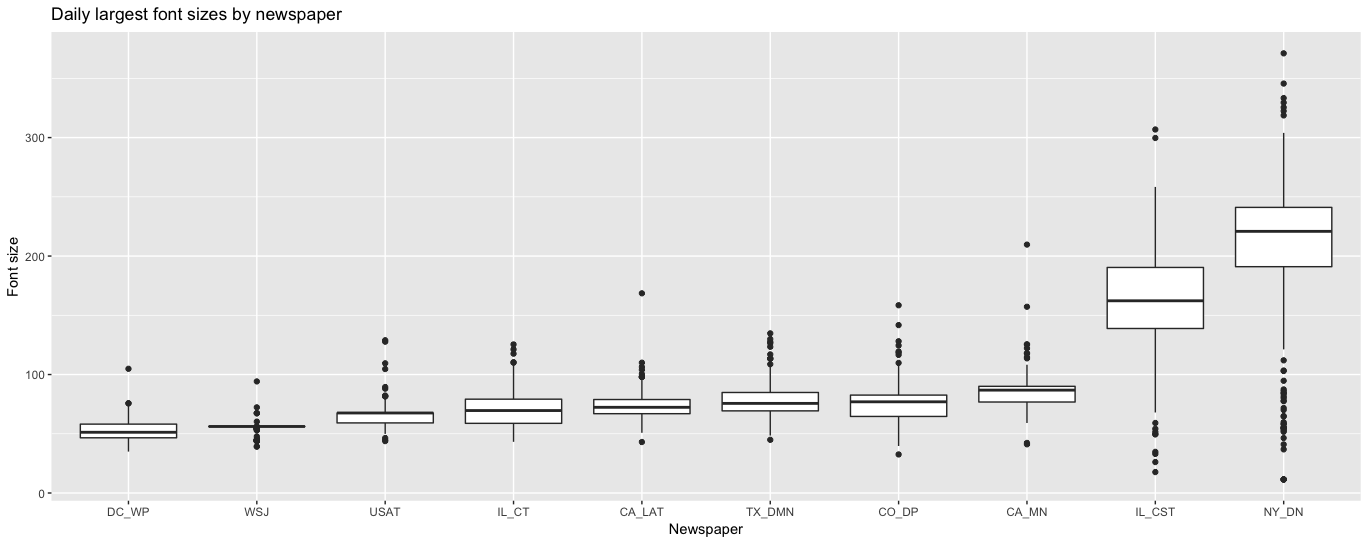
So what else can we learn from the top sized headlines on these journals?

/ insert intermission where I switch into R and run ggplot to generate this graph: link. Look at that graph if you haven't yet because it motivates some of the following.

We can see a wide distribution of biggest-headlines-per-day (what I'll ignorantly call the "splash" headline, please let me know if you know of the actual newspaper jargon) for each major newspaper. On the right-hand side, the tabloids tend to be extremely generous with how they use fonts. Let's see if that holds up at large.

As a refresher, here are some common newspaper formats from Wikipedia:


    Diver's Dispatch 914.4 mm × 609.6 mm (36.00 in × 24.00 in) (1.5)
    Broadsheet 749 mm × 597 mm (29.5 in × 23.5 in) (1.255)
    Nordisch 570 mm × 400 mm (22 in × 16 in) (1.425)
    Rhenish around 350 mm × 520 mm (14 in × 20 in) (1.486)
    Swiss (Neue Zürcher Zeitung) 475 mm × 320 mm (18.7 in × 12.6 in) (1.484)
    Berliner 470 mm × 315 mm (18.5 in × 12.4 in) (1.492)
        The Guardian's printed area is 443 mm × 287 mm (17.4 in × 11.3 in).[2]
    Tabloid 430 mm × 280 mm (17 in × 11 in) (1.536)

We'll mainly just look at the height here for simplicity's sake.

Note these numbers will be slightly off since:

  • the PDFs contain different amounts of additional padding compared to the actual printed version
  • these numbers are in pixels, and depending on how the resolution of the newspaper is determined, could translate into different numbers in inches

In [250]:
%matplotlib inline
import matplotlib.pyplot as plt
import seaborn as sns

sns.distplot(df.groupby(['slug']).page_height.first())
plt.suptitle("Distribution of page heights (by pixels)")


Out[250]:
<matplotlib.text.Text at 0x7f599b72ccc0>

So it looks like most of our newspapers are clustered around the 1600px height. But what is that in inches? Let's do a few known papers to check.


In [245]:
print('''Heights of known papers:

Broadsheets:
The Washington Post: {}px
The Wall Street Journal: {}px

Tabloids:
The Chicago Sun Times: {}px
The New York Daily News: {}px
'''.format(
    df[df.slug == 'DC_WP'].page_height.mode().iloc[0],
    df[df.slug == 'WSJ'].page_height.mode().iloc[0],
    df[df.slug == 'IL_CST'].page_height.mode().iloc[0],
    df[df.slug == 'NY_DN'].page_height.mode().iloc[0]
))


Heights of known papers:

Broadsheets:
The Washington Post: 1709.05px
The Wall Street Journal: 1567.8px

Tabloids:
The Chicago Sun Times: 720.0px
The New York Daily News: 878.4px


In [244]:
print('''Aspect ratios of known papers:

Broadsheets:
The Washington Post: {}
The Wall Street Journal: {}

Tabloids:
The Chicago Sun Times: {}
The New York Daily News: {}
'''.format(
    df[df.slug == 'DC_WP'].aspect_ratio.mode().iloc[0],
    df[df.slug == 'WSJ'].aspect_ratio.mode().iloc[0],
    df[df.slug == 'IL_CST'].aspect_ratio.mode().iloc[0],
    df[df.slug == 'NY_DN'].aspect_ratio.mode().iloc[0]
))


Aspect ratios of known papers:

Broadsheets:
The Washington Post: 0.6
The Wall Street Journal: 0.5

Tabloids:
The Chicago Sun Times: 1.1
The New York Daily News: 0.8

By our very rough check, the two broadsheets tended to be >1500px height with an aspect ratio around 1:2, and the tabloids are shorter with an aspect ratio around 1.

Let's see how this plays out with font sizes.


In [292]:
from scipy import stats
import numpy as np

def mode(heights):
    return stats.mode(heights).mode[0]

daily_headlines = df.groupby(['date', 'slug']).agg({'fontsize': max, 'page_height': mode, 'aspect_ratio': mode})

In [293]:
daily_headlines.head()


Out[293]:
fontsize page_height aspect_ratio
date slug
2017-04-01 AK_FDNM 57.528 1593.36 0.5
AL_AS 52.360 1512.00 0.5
AL_DD 66.000 1512.00 0.5
AL_DE 101.932 1584.00 0.5
AL_GT 58.094 1584.00 0.5

In [294]:
avg_size_by_paper = daily_headlines.reset_index().groupby('slug').agg({'fontsize': np.mean, 'page_height': mode, 'aspect_ratio': mode, 'slug': 'count'}).rename(columns={'slug': 'n'})
avg_size_by_paper.head()


Out[294]:
fontsize page_height aspect_ratio n
slug
AK_DN 63.871000 1584.00 0.5 2
AK_DSS 47.356186 1656.00 0.7 97
AK_FDNM 68.031140 1593.36 0.5 236
AK_JE 57.275935 1566.00 0.5 200
AL_ACO 99.147000 1746.00 0.5 4

In [295]:
sns.distplot(avg_size_by_paper['n'], kde=False, bins=30)
plt.xlim([0, 250])
plt.suptitle("Distribution of number of days each paper has records in the scrape")

avg_size_by_paper['n'].describe()


Out[295]:
count    740.000000
mean     147.635135
std       85.923381
min        1.000000
25%       56.750000
50%      182.000000
75%      231.000000
max      237.000000
Name: n, dtype: float64

In [296]:
avg_size_highly_present = avg_size_by_paper[avg_size_by_paper['n'] > 182]  # more than the median

In [318]:
sns.regplot(avg_size_highly_present.page_height, avg_size_highly_present.fontsize, fit_reg=False)
plt.xlabel("Page height in pixels")
plt.ylabel("Average font point of day's largest headline")
plt.suptitle("Each dot is a newspaper")


Out[318]:
<matplotlib.text.Text at 0x7f5b31496e10>

In [317]:
sns.regplot(avg_size_highly_present.aspect_ratio, avg_size_highly_present.fontsize, x_jitter=0.01, fit_reg=False)
plt.xlabel("Aspect ratio (width/height)")
plt.ylabel("Average font point of day's largest headline")
plt.suptitle("Each dot is a newspaper")


Out[317]:
<matplotlib.text.Text at 0x7f5b314967b8>

In [310]:
sns.regplot(avg_size_highly_present.aspect_ratio, avg_size_highly_present.fontsize, x_jitter=0.05, fit_reg=False)


Out[310]:
<matplotlib.axes._subplots.AxesSubplot at 0x7f5aa3516fd0>

Three observations:

  1. There aren't that many "tabloids"! (if the page height and aspect ratio heuristics are accurate)
  2. There is a clear pattern toward larger font-sizes on the higher aspect ratio, lower height end of the spectrum.
  3. If we add a lot of jitter to the rounded aspect ratio, we end up with a very similar-looking graph to the height itself.

So what are those outliers?


In [306]:
avg_size_highly_present.sort_values(by='fontsize', ascending=False).head(10)


Out[306]:
fontsize page_height aspect_ratio n
slug
NY_DN 203.829759 878.400 0.8 228
IL_CST 162.594638 720.000 1.1 232
NJ_TT 131.437970 792.000 1.0 233
PA_DCDT 124.709742 792.000 1.0 229
PA_PDN 121.913063 730.800 1.0 192
GA_AH 118.049375 1610.160 0.5 200
SC_IJ 113.504180 1584.000 0.5 222
NY_EDLP 108.456987 869.695 0.9 232
OH_TI 105.504005 1548.000 0.5 203
TX_VMS 104.859916 1440.000 0.5 191

The biggest outliers with font size for tabloids turned out to be the ones in our most-circulated newspaper dataset, so my prior was skewed toward the large size. However, all 5 of the biggest font-using newspapers were "tabloids", so there is some truth to it. The data is a bit too categorical between broadsheet and tabloid, and I'm too fuzzy on the space in between, to make any overarching conclusions!

Let's go back and double-check how closely the height maps to the aspect ratio.


In [312]:
sns.regplot(avg_size_highly_present.aspect_ratio, avg_size_highly_present.page_height, x_jitter=0.01, fit_reg=False)


Out[312]:
<matplotlib.axes._subplots.AxesSubplot at 0x7f593ff93f28>