Two following input files are required in this tutorial
BackBoneCHiDihedrals_cdna.dat (do_x3dna output from the trajectory, which contains the DNA bound with the protein)BackBoneCHiDihedrals_odna.dat (do_x3dna output from the trajectory, which only contains the free DNA)
These two file should be present inside tutorial_data of the current/present working directory.
do_x3dna is executed with -ref option.
In [1]:


import numpy as np
import matplotlib.pyplot as plt
import matplotlib as mpl

import dnaMD

%matplotlib inline
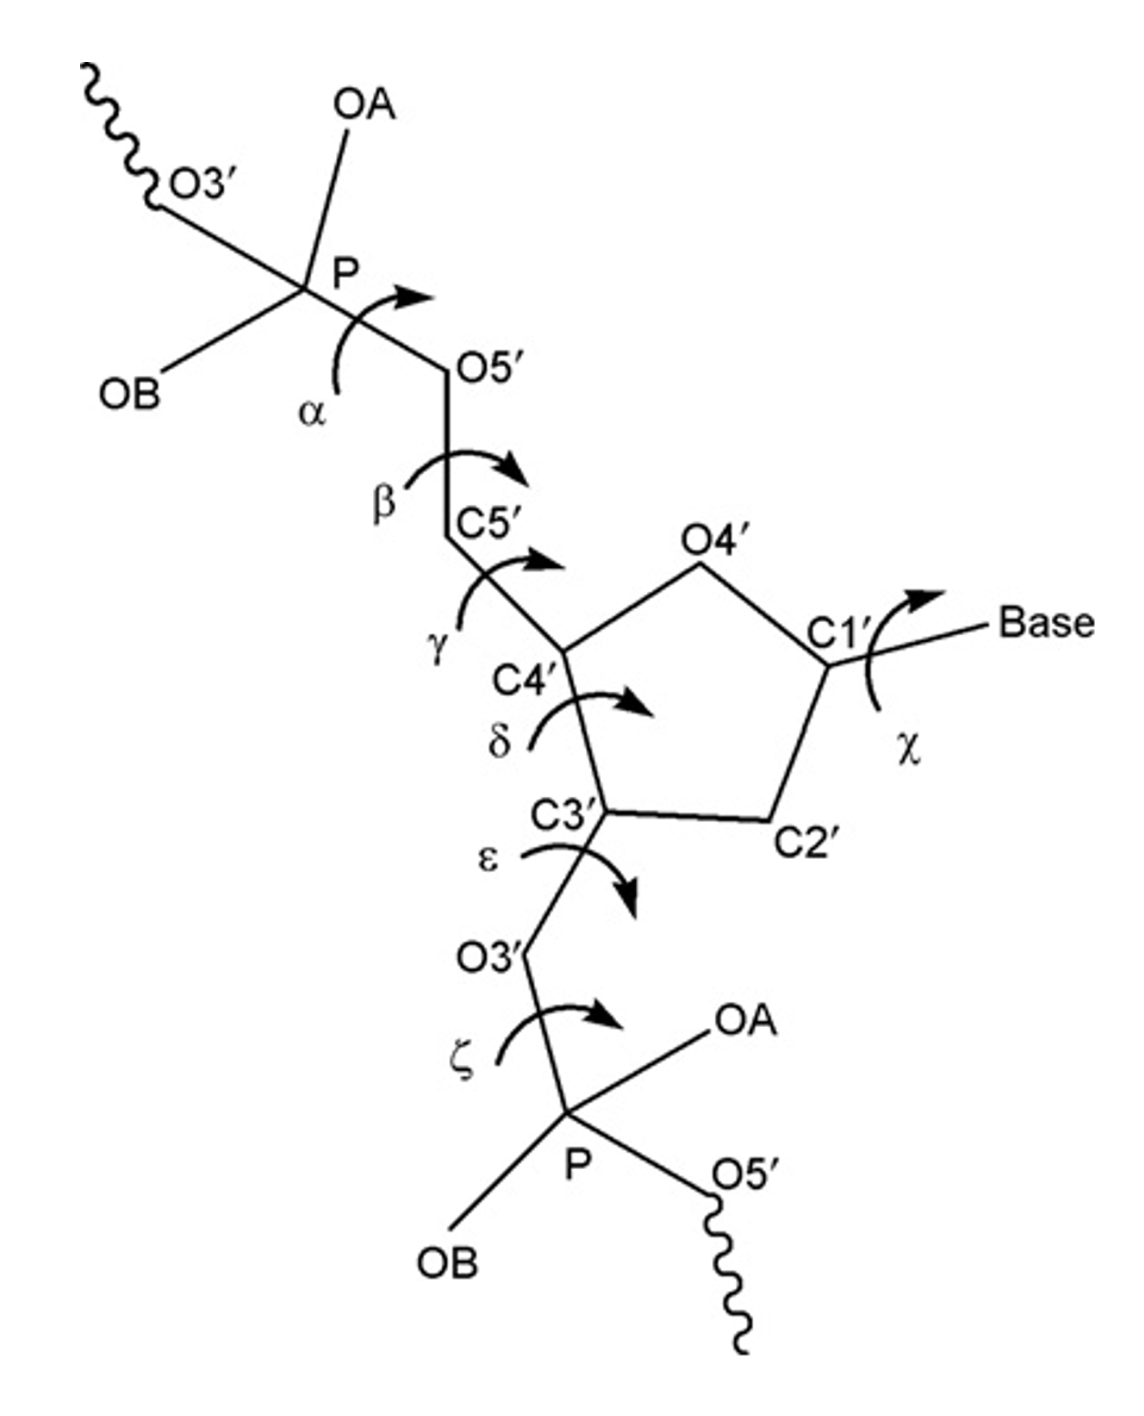
These torsion angles of both strands can be read and stored in DNA object from the input file using function set_backbone_dihedrals(...).
To speed up processing and analysis, data can be stored in a HDF5 file by including HDF5 file name as a argument during initialization. Same file can be used to store and retrieve all other parameters.
In [2]:


## Initialization
pdna = dnaMD.DNA(60)     #Initialization for 60 base-pairs DNA bound with the protein
fdna = dnaMD.DNA(60)     #Initialization for 60 base-pairs free DNA

## If HDF5 file is used to store/save data use these:
# pdna = dnaMD.DNA(60, filename='cdna.h5')     #Initialization for 60 base-pairs DNA bound with the protein
# fdna = dnaMD.DNA(60, filename='odna.h5')     #Initialization for 60 base-pairs free DNA

## Loading data from input files in respective DNA object
# parameters = 'All'
# will read and store alpha, beta, gamma, delta, epsilon, zeta and chi dihedrals of both strands
pdna.set_backbone_dihedrals('tutorial_data/BackBoneCHiDihedrals_cdna.dat', bp=[2, 59], parameters='All', bp_range=True)
fdna.set_backbone_dihedrals('tutorial_data/BackBoneCHiDihedrals_odna.dat', bp=[2, 59], parameters='All', bp_range=True)
Following example shows alpha, $\alpha$ of first strand vs Time plots. These example also shows that how to extract the parameters value from the DNA object. Other properties could be extracted and plotted using similar steps.
In [3]:


# Extracting "alpha" of first strand of 20 to 30 base-steps
alpha_S1, bp_idx = fdna.get_parameters('alpha S1',[20,30], bp_range=True)

# SI-alpha vs Time for 22nd base-pair
plt.title('22nd bp')
plt.plot(pdna.time, alpha_S1[2])      # index is 2 for 22nd base-step: (20 + 2)
plt.xlabel('Time (ps)')
plt.ylabel(r'$\alpha$-S1 ( $^o$)')
plt.show()

# Average SI-alpha vs Time for segment 20-30 base-pairs
avg_alpha_S1 = np.mean(alpha_S1, axis=0)     # Calculation of mean using mean function of numpy
plt.title('20-30 bp segment')
plt.plot(pdna.time, avg_alpha_S1)
plt.xlabel('Time (ps)')
plt.ylabel(r'$\alpha$-S1 ( $^o$)')
plt.show()

# Average SI-alpha vs Time for segment 24-28 base-step
# index of 24th base-step is 4 (20 + 4). index of 28th base-step is 8 (20 + 8)
avg_alpha_S1 = np.mean(alpha_S1[4:8], axis=0)
plt.title('24-28 bp segment')
plt.plot(pdna.time, avg_alpha_S1)
plt.xlabel('Time (ps)')
plt.ylabel(r'$\alpha$-S1 ( $^o$)')
plt.show()
Above examples show the method to extract the values from the DNA object. However, dnaMD.DNA.time_vs_parameter(...) function could be use to get torsion angle as a function of time for the given nucleotides or strand of the DNA segment
In [4]:


# S1-gamma and S2-gamma vs Time for 22nd bp
plt.title(r'$\gamma$ for 22nd bp')
time, S1 = fdna.time_vs_parameter('gamma S1', [22])
time, S2 = fdna.time_vs_parameter('gamma S2', [22])
plt.plot(time, S1, c='b', label='Strand-1')
plt.plot(time, S2, c='r', label='Strand-2')
plt.xlabel('Time (ps)')
plt.ylabel('$\gamma$ ( $^o$)')
plt.legend()
plt.show()

# alpha-S2 vs Time for 25-40 bp segment
plt.title(r'$\alpha$-S2 for 25-40 bp segment')
# Bound DNA
# Assume that the torsion angle a given segment is average over the nucelotides
time, value = pdna.time_vs_parameter('alpha S2', [25, 40], merge=True, merge_method='mean')
plt.plot(time, value, label='bound DNA', c='k')     # balck color => bound DNA
# Free DNA
time, value = fdna.time_vs_parameter('alpha S2', [25, 40], merge=True, merge_method='mean')
plt.plot(time, value, label='free DNA', c='r')    # red color => free DNA

plt.xlabel('Time (ps)')
plt.ylabel(r'$\alpha$ ( $^o$)')
plt.legend()
plt.show()
In [5]:


def plot_angle_wheel(angles, colormap, color_res = 20, bin_size=2, ax=None, cb_pad=0.2, cb_shrink=0.75):
    """ Plot torsion wheel for given number of angles

        Arguments:

            angles (2D array): of shape (type,numbers)

            colormap (string): name of colormap

            color_res (int) : number of color-bins in colormap

            bin_size (int) : size of bin in Degree for calculation of histogram

            axis  (matplotlib axis): matplotlib axis instance. If (ax != None), colorbar instance will be returned.

            cb_pad (float): Gap between wheel-plot and colorbar

            cb_shrink (float): To increase or decrease size of colorbar


        Return:

            None : If ax=None

            or

            colorbar (matplotlib colorbar): if (ax != None) matplotlib colorbar instance.
                                            This can be used to modify properties of color-bar

    """

    angles = np.asarray(angles)

    # Number of angle types to plot
    nangle = angles.shape[0]

    # Number of input angles for each angle type
    nframe = angles.shape[1]

    angle_hist = []

    # Creating reference array of angle for histogram
    hist_idx = np.arange(0, 360, bin_size, dtype=float)

    # Initializing histogram array over 360 Deg using bin-size
    for i in range(nangle):
        angle_hist.append(np.zeros(hist_idx.shape[0]))
    angle_hist = np.asarray(angle_hist)

    #### Calculating histogram ###
    for i in range(len(angles)):
        for j in range(len(angles[i])):

            # Converting angle of negative direction to postive direction
            if angles[i][j]<0:
                tmp_theta = 360 + angles[i][j]
            else:
                tmp_theta = angles[i][j]

            # Finding index in reference array for angle (index of nearest value)
            idx = (np.abs(hist_idx-tmp_theta)).argmin()

            # Updating angle histogram
            angle_hist[i][idx] += 1

        # Calculating fraction/precentage
        angle_hist[i] = np.divide(angle_hist[i],nframe)

    # minimum and maximum value
    min_max = [0.0, np.amax(angle_hist)]

    # Creating COLORMAP. To change colormap, see this link:
    # (http://matplotlib.org/examples/color/colormaps_reference.html)
    # Creating array for color-range
    crange = np.linspace(0, min_max[1], color_res)

    # Creating array of color;
    # To automate colormap inside a method,
    # Following is equivalent to: color = plt.cm.colormap(crange);
    # where colormap could be any type of maps that are implemented in the matplotlib
    color = getattr(plt.cm, colormap)(crange)

    #### Plotting wheel ####
    # Width of bin in radian
    width = bin_size*(np.pi/180)

    # Plot each bin with respective color
    # First loop over concentric circles
    # Second loop along the respective circle
    for i in range(len(angle_hist)):
        for j in range(len(angle_hist[i])):

            # Identifying index of color in color array using value of histogram
            c_idx = (np.abs(crange - angle_hist[i][j])).argmin()

            # Plotting circular-bar of radius=1 for respective bin, each bar start at radius=i+1 and end at radius=i+2
            if angle_hist[i][j] > 0.0:
                plt.bar(hist_idx[j]*(np.pi/180), 1, width=width, bottom=i+1, color=color[c_idx], linewidth=0)

    # To draw Colorbar. Taken from the following link:
    # (http://stackoverflow.com/questions/8342549/matplotlib-add-colorbar-to-a-sequence-of-line-plots)
    if ax:
        cmap = getattr(mpl.cm, colormap)
        norm = mpl.colors.Normalize(vmin=min_max[0], vmax=min_max[1])
        sm = plt.cm.ScalarMappable(cmap=cmap, norm=norm)
        sm._A = []
        cb = plt.colorbar(sm, ax=ax, pad=cb_pad, shrink=cb_shrink)
        return cb
    else:
        return None
In [6]:


# Initialization of plot with resolution and figure size
fig = plt.figure(figsize=(14, 8))

# For large figure, use this
#fig = plt.figure(figsize=(18, 12), dpi=300)

# To adjust gaps and margins of subplots
fig.subplots_adjust(wspace=0.3)


##### Plot for first Strand #####
angels_type = ['alpha S1', 'beta S1', 'gamma S1', 'delta S1', 'epsilon S1', 'zeta S1']
label = [r'$\alpha$', r'$\beta$', r'$\gamma$', r'$\delta$', r'$\epsilon$', r'$\zeta$']

# Initialization of first axis or subplot
ax1 = plt.subplot(121, polar=True)
ax1.set_title('Strand I', fontsize=22, y = 1.2)

# to change properties of radial and circular grid-line from dashed to solid
ax1.grid(True, lw=0.5, linestyle='-')

# Extraction of angle data from DNA object
angles = []
for ang_name in angels_type:
    values = []
    # Extract all individual angles of 10th to 50th base-pairs
    for nbp in range(10,50):
        time, value = fdna.time_vs_parameter(ang_name, [nbp], merge=False, merge_method='mean')
        del time
        values = values + list(value)
    angles.append(np.array(values))

# Change list to numpy array
angles = np.asarray(angles)

# Plot angle wheel with "winter_r" colormap
colorbar = plot_angle_wheel(angles, colormap='winter_r', color_res=10, bin_size=5,
                            ax= ax1, cb_pad=0.15, cb_shrink=0.65)

# Labeling wheel for each angle type
ax1.yaxis.set_ticklabels(label, fontsize=22)

##### To increase font-size of angle around perimeter
# Get angle label, which are present at the perimeter of wheel and change it to Degree
xticks = ax1.get_xticks()*180/np.pi
xlabel = []

# Convert angle to string and add Degree symbol
for x in xticks:
    xlabel.append('{0}$^o$' .format(int(x)))

# Change postion of angle label to remove any overlap
ax1.set_thetagrids(xticks, frac=1.22)

# At last change the fontsize
ax1.xaxis.set_ticklabels(xlabel, fontsize=22)

# Change the fontsize in colorbar
for text in colorbar.ax.get_yticklabels():
    text.set_fontsize(22)

# Clean memory
del angles

##### Plot for Second Strand #####
angels_type = ['alpha S2', 'beta S2', 'gamma S2', 'delta S2', 'epsilon S2', 'zeta S2']
label = [r'$\alpha$', r'$\beta$', r'$\gamma$', r'$\delta$', r'$\epsilon$', r'$\zeta$']

# Initialization of first axis
ax2 = plt.subplot(122, polar=True)
ax2.set_title('Strand II', fontsize=22, y = 1.2)

# to change properties of grid-line
ax2.grid(True, lw=0.5, linestyle='-')

# Extraction of angle data
angles = []
for ang_name in angels_type:
    values = []
    # Extract all angles of 10th to 50th base-pairs
    for nbp in range(10,50):
        time, value = fdna.time_vs_parameter(ang_name, [nbp], merge=False, merge_method='mean')
        del time
        values = values + list(value)
    angles.append(np.array(values))

# Change list to numpy array
angles = np.asarray(angles)

# Plot angle wheel with "winter_r" colormap
colorbar = plot_angle_wheel(angles, colormap='winter_r', color_res=10, bin_size=5,
                            ax= ax2, cb_pad=0.15, cb_shrink=0.65)

# Labeling wheel for each angle type
ax2.yaxis.set_ticklabels(label, fontsize=22)

##### To increase font-size of angle around perimeter
# Get angle label, which are present at the perimeter of wheel and change it to Degree
xticks = ax2.get_xticks()*180/np.pi
xlabel = []

# Convert angle to string and add Degree symbol
for x in xticks:
    xlabel.append('{0}$^o$' .format(int(x)))

# Change postion of angle label to remove any overlap
ax2.set_thetagrids(xticks, frac=1.22)

# At last change the fontsize
ax2.xaxis.set_ticklabels(xlabel, fontsize=22)

# Change the fontsize in colorbar
for text in colorbar.ax.get_yticklabels():
    text.set_fontsize(22)

# Clean memory
del angles

plt.show()
In [7]:


# Initialization of plot
fig = plt.figure(figsize=(14, 8))

# For large figure, use this
#fig = plt.figure(figsize=(18, 12), dpi=300)

fig.subplots_adjust(wspace=0.2)


##### Plot for first Strand #####
angels_type = ['alpha S1', 'beta S1', 'gamma S1', 'delta S1', 'epsilon S1', 'zeta S1']
label = [r'$\alpha$', r'$\beta$', r'$\gamma$', r'$\delta$', r'$\epsilon$', r'$\zeta$']

# Initialization of first axis
ax1 = plt.subplot(121, polar=True)
ax1.set_title('Strand I 25-35 bp', fontsize=22, y = 1.2)

# to change properties of grid-line
ax1.grid(True, lw=0.5, linestyle='-')

# Extraction of angle data
angles = []
for ang_name in angels_type:
    # To calculate the angle for a segment, angles are avereged over base-pairs
    time, value = fdna.time_vs_parameter(ang_name, [25, 35], merge=True, merge_method='mean')
    del time
    angles.append(value)

# Change list to numpy array
angles = np.asarray(angles)

# Plot angle wheel with "winter_r" colormap
colorbar = plot_angle_wheel(angles, colormap='winter_r', color_res=10, bin_size=5,
                            ax= ax1, cb_pad=0.15, cb_shrink=0.5)

# Labeling wheel for each angle type
ax1.yaxis.set_ticklabels(label, fontsize=22)

##### To increase font-size of angle around perimeter
# Get angle label, which are present at the perimeter of wheel and change it to Degree
xticks = ax1.get_xticks()*180/np.pi
xlabel = []

# Convert angle to string and add Degree symbol
for x in xticks:
    xlabel.append('{0}$^o$' .format(int(x)))

# Change postion of angle label to remove any overlap
ax1.set_thetagrids(xticks, frac=1.22)

# At last change the fontsize
ax1.xaxis.set_ticklabels(xlabel, fontsize=22)

# Change the fontsize in colorbar
for text in colorbar.ax.get_yticklabels():
    text.set_fontsize(22)

# Clean memory
del angles

##### Plot for Second Strand #####
angels_type = ['alpha S2', 'beta S2', 'gamma S2', 'delta S2', 'epsilon S2', 'zeta S2']
label = [r'$\alpha$', r'$\beta$', r'$\gamma$', r'$\delta$', r'$\epsilon$', r'$\zeta$']

# Initialization of first axis
ax2 = plt.subplot(122, polar=True)
ax2.set_title('Strand II 25-35 bp', fontsize=22, y = 1.2)

# to change properties of grid-line
ax2.grid(True, lw=0.5, linestyle='-')

# Extraction of angle data
angles = []
for ang_name in angels_type:
    # To calculate the angle for a segment, angles are avereged over base-pairs
    time, value = fdna.time_vs_parameter(ang_name, [25, 35], merge=True, merge_method='mean')
    del time
    angles.append(value)

# Change list to numpy array
angles = np.asarray(angles)

# Plot angle wheel with "winter_r" colormap
colorbar = plot_angle_wheel(angles, colormap='winter_r', color_res=10, bin_size=5,
                            ax= ax2, cb_pad=0.15, cb_shrink=0.5)

# Labeling wheel for each angle type
ax2.yaxis.set_ticklabels(label, fontsize=22)

##### To increase font-size of angle around perimeter
# Get angle label, which are present at the perimeter of wheel and change it to Degree
xticks = ax2.get_xticks()*180/np.pi
xlabel = []

# Convert angle to string and add Degree symbol
for x in xticks:
    xlabel.append('{0}$^o$' .format(int(x)))

# Change postion of angle label to remove any overlap
ax2.set_thetagrids(xticks, frac=1.22)

# At last change the fontsize
ax2.xaxis.set_ticklabels(xlabel, fontsize=22)

# Change the fontsize in colorbar
for text in colorbar.ax.get_yticklabels():
    text.set_fontsize(22)

# Clean memory
del angles

plt.show()
In [8]:


# Initialization of plot
fig = plt.figure(figsize=(14, 20))
fig.subplots_adjust(hspace=0.4)


##### Plot for first Strand #####
angels_type = ['alpha S1', 'beta S1', 'gamma S1', 'delta S1', 'epsilon S1', 'zeta S1']
label = [r'$\alpha$', r'$\alpha$', r'$\beta$', r'$\beta$', r'$\gamma$', r'$\gamma$', r'$\delta$', r'$\delta$',
         r'$\epsilon$', r'$\epsilon$', r'$\zeta$', r'$\zeta$']

# Initialization of first axis
ax1 = plt.subplot(211, polar=True)
ax1.set_title('Strand I', fontsize=22, y = 1.15)

# to change properties of grid-line
ax1.grid(True, lw=0.5, linestyle='-')

# Extraction of angle data
angles = []
for ang_name in angels_type:
    # To calculate the angle for a segment, angles are avereged over base-pairs

    # Unbound DNA
    time, value = fdna.time_vs_parameter(ang_name, [25, 40], merge=True, merge_method='mean')
    del time
    angles.append(value)

    # Bound DNA
    time, value = pdna.time_vs_parameter(ang_name, [25, 40], merge=True, merge_method='mean')
    angles.append(value)

# Change list to numpy array
angles = np.asarray(angles)

# Plot angle wheel with "winter_r" colormap
colorbar = plot_angle_wheel(angles, colormap='winter_r', color_res=10, bin_size=5,
                            ax=ax1, cb_pad=0.1, cb_shrink=0.75)

# Labeling wheel for each angle type
ax1.yaxis.set_ticks(range(1,13))
ax1.yaxis.set_ticklabels(label, fontsize=22)
plt.ylim(0,13)

##### To increase font-size of angle around perimeter
# Get angle label, which are present at the perimeter of wheel and change it to Degree
xticks = ax1.get_xticks()*180/np.pi
xlabel = []

# Convert angle to string and add Degree symbol
for x in xticks:
    xlabel.append('{0}$^o$' .format(int(x)))

# Change postion of angle label to remove any overlap
ax1.set_thetagrids(xticks, frac=1.18)

# At last change the fontsize
ax1.xaxis.set_ticklabels(xlabel, fontsize=22)

# Change the fontsize in colorbar
for text in colorbar.ax.get_yticklabels():
    text.set_fontsize(22)

# Clean memory
del angles

##### Plot for Second Strand #####
angels_type = ['alpha S2', 'beta S2', 'gamma S2', 'delta S2', 'epsilon S2', 'zeta S2']
label = [r'$\alpha$', r'$\alpha$', r'$\beta$', r'$\beta$', r'$\gamma$', r'$\gamma$', r'$\delta$', r'$\delta$',
         r'$\epsilon$', r'$\epsilon$', r'$\zeta$', r'$\zeta$']

# Initialization of first axis
ax2 = plt.subplot(212, polar=True)
ax2.set_title('Strand II', fontsize=22, y = 1.15)

# to change properties of grid-line
ax2.grid(True, lw=0.5, linestyle='-')

# Extraction of angle data
angles = []
for ang_name in angels_type:
    # To calculate the angle for a segment, angles are avereged over base-pairs

    # Unbound DNA
    time, value = fdna.time_vs_parameter(ang_name, [25, 40], merge=True, merge_method='mean')
    del time
    angles.append(value)

    # Bound DNA
    time, value = pdna.time_vs_parameter(ang_name, [25, 40], merge=True, merge_method='mean')
    angles.append(value)

# Change list to numpy array
angles = np.asarray(angles)

# Plot angle wheel with "PuRd" (purple-red) colormap
colorbar = plot_angle_wheel(angles, colormap='winter_r', color_res=10, bin_size=5,
                            ax=ax2, cb_pad=0.1, cb_shrink=0.75)

# Labeling wheel for each angle type
ax2.yaxis.set_ticks(range(1,13))
ax2.yaxis.set_ticklabels(label, fontsize=22)
plt.ylim(0,13)

##### To increase font-size of angle around perimeter
# Get angle label, which are present at the perimeter of wheel and change it to Degree
xticks = ax2.get_xticks()*180/np.pi
xlabel = []

# Convert angle to string and add Degree symbol
for x in xticks:
    xlabel.append('{0}$^o$' .format(int(x)))

# Change postion of angle label to remove any overlap
ax2.set_thetagrids(xticks, frac=1.18)

# At last change the fontsize
ax2.xaxis.set_ticklabels(xlabel, fontsize=22)

# Change the fontsize in colorbar
for text in colorbar.ax.get_yticklabels():
    text.set_fontsize(22)

# Clean memory
del angles

plt.show()
In [ ]: