Agenda

  • Define the problem and the approach
  • Data basics: loading data, looking at your data, basic commands
  • Handling missing values
  • Intro to scikit-learn

  • Grouping and aggregating data
  • Feature selection
  • Fitting and evaluating a model
  • Deploying your work

In this notebook you will

  • Take a tour of scikit-learn and learn what it's used for
  • Build a toy classifier
  • Make and vizualize a decision tree
  • Build your own regression model

In [1]:
import pandas as pd
import numpy as np
import pylab as pl

Consistent APIs

Algorithms are implemented with the same core functions:

  • fit = train an algorithm
  • predict = predict the value for a given record
  • predict_proba = predict the probability of all possible classes for a given record (classification only)
  • transform = alter your data based on a given preprocessor (i.e. normalize or scale your data) (preprocessing/unsuperivsed)
  • fit_transform = train a preprocessor and then transform the data in a single step (preprocessing/unsuperivsed)


In [2]:
from sklearn.datasets import load_iris

iris = load_iris()
df = pd.DataFrame(iris.data, columns=iris.feature_names)
df['species'] = iris.target

In [3]:
from sklearn.svm import SVC
from sklearn.neighbors import KNeighborsClassifier

In [6]:
svm_clf = SVC()
neighbors_clf = KNeighborsClassifier()
clfs = [
    ("svc", SVC()),
    ("KNN", KNeighborsClassifier())
    ]
for name, clf in clfs:
    clf.fit(df[iris.feature_names], df.species)
    print name, clf.predict(iris.data)
    pd.crosstab(df.species, clf.predict(df[iris.feature_names]))
    print "*"*80


svc [0 0 0 0 0 0 0 0 0 0 0 0 0 0 0 0 0 0 0 0 0 0 0 0 0 0 0 0 0 0 0 0 0 0 0 0 0
 0 0 0 0 0 0 0 0 0 0 0 0 0 1 1 1 1 1 1 1 1 1 1 1 1 1 1 1 1 1 1 1 1 1 1 1 1
 1 1 1 2 1 1 1 1 1 2 1 1 1 1 1 1 1 1 1 1 1 1 1 1 1 1 2 2 2 2 2 2 2 2 2 2 2
 2 2 2 2 2 2 2 2 2 2 2 2 2 2 2 2 2 2 2 2 2 2 2 2 2 2 2 2 2 2 2 2 2 2 2 2 2
 2 2]
********************************************************************************
KNN [0 0 0 0 0 0 0 0 0 0 0 0 0 0 0 0 0 0 0 0 0 0 0 0 0 0 0 0 0 0 0 0 0 0 0 0 0
 0 0 0 0 0 0 0 0 0 0 0 0 0 1 1 1 1 1 1 1 1 1 1 1 1 1 1 1 1 1 1 1 1 2 1 2 1
 1 1 1 1 1 1 1 1 1 2 1 1 1 1 1 1 1 1 1 1 1 1 1 1 1 1 2 2 2 2 2 2 1 2 2 2 2
 2 2 2 2 2 2 2 2 1 2 2 2 2 2 2 2 2 2 2 2 2 2 2 2 2 2 2 2 2 2 2 2 2 2 2 2 2
 2 2]
********************************************************************************

Try a RandomForetClassifier (from sklearn.ensemble import RandomForestClassifier) and see how it does


In [7]:
from sklearn.ensemble import RandomForestClassifier
clf = RandomForestClassifier()
clf.fit(df[iris.feature_names], df.species)
clf.predict(df[iris.feature_names])
pd.crosstab(df.species, clf.predict(df[iris.feature_names]))


//anaconda/lib/python2.7/site-packages/pandas/core/config.py:570: DeprecationWarning: height has been deprecated.

  warnings.warn(d.msg, DeprecationWarning)
//anaconda/lib/python2.7/site-packages/pandas/core/config.py:570: DeprecationWarning: height has been deprecated.

  warnings.warn(d.msg, DeprecationWarning)
Out[7]:
col_0 0 1 2
species
0 50 0 0
1 0 50 0
2 0 3 47

A Quick Decision Tree Example

more examples

Import the decision tree library and train a classifier


In [7]:
from sklearn import tree

clf = tree.DecisionTreeClassifier(max_features="auto",
                                  min_samples_leaf=10)
clf.fit(df[iris.feature_names], df.species)


Out[7]:
DecisionTreeClassifier(compute_importances=None, criterion='gini',
            max_depth=None, max_features='auto', min_density=None,
            min_samples_leaf=10, min_samples_split=2, random_state=None,
            splitter='best')

Write the tree to a file


In [8]:
from sklearn.externals.six import StringIO
with open("iris.dot", 'w') as f:
    f = tree.export_graphviz(clf, out_file=f)

We're going to convert it to a .png so we can display it in the notebook


In [9]:
# you will need to install graphviz 
#(http://www.graphviz.org/Download..php) and pydot (pip install pydot)
! dot -Tpng iris.dot -o iris.png

In [10]:
from IPython.core.display import Image
Image("iris.png")


Out[10]:

What to do first?

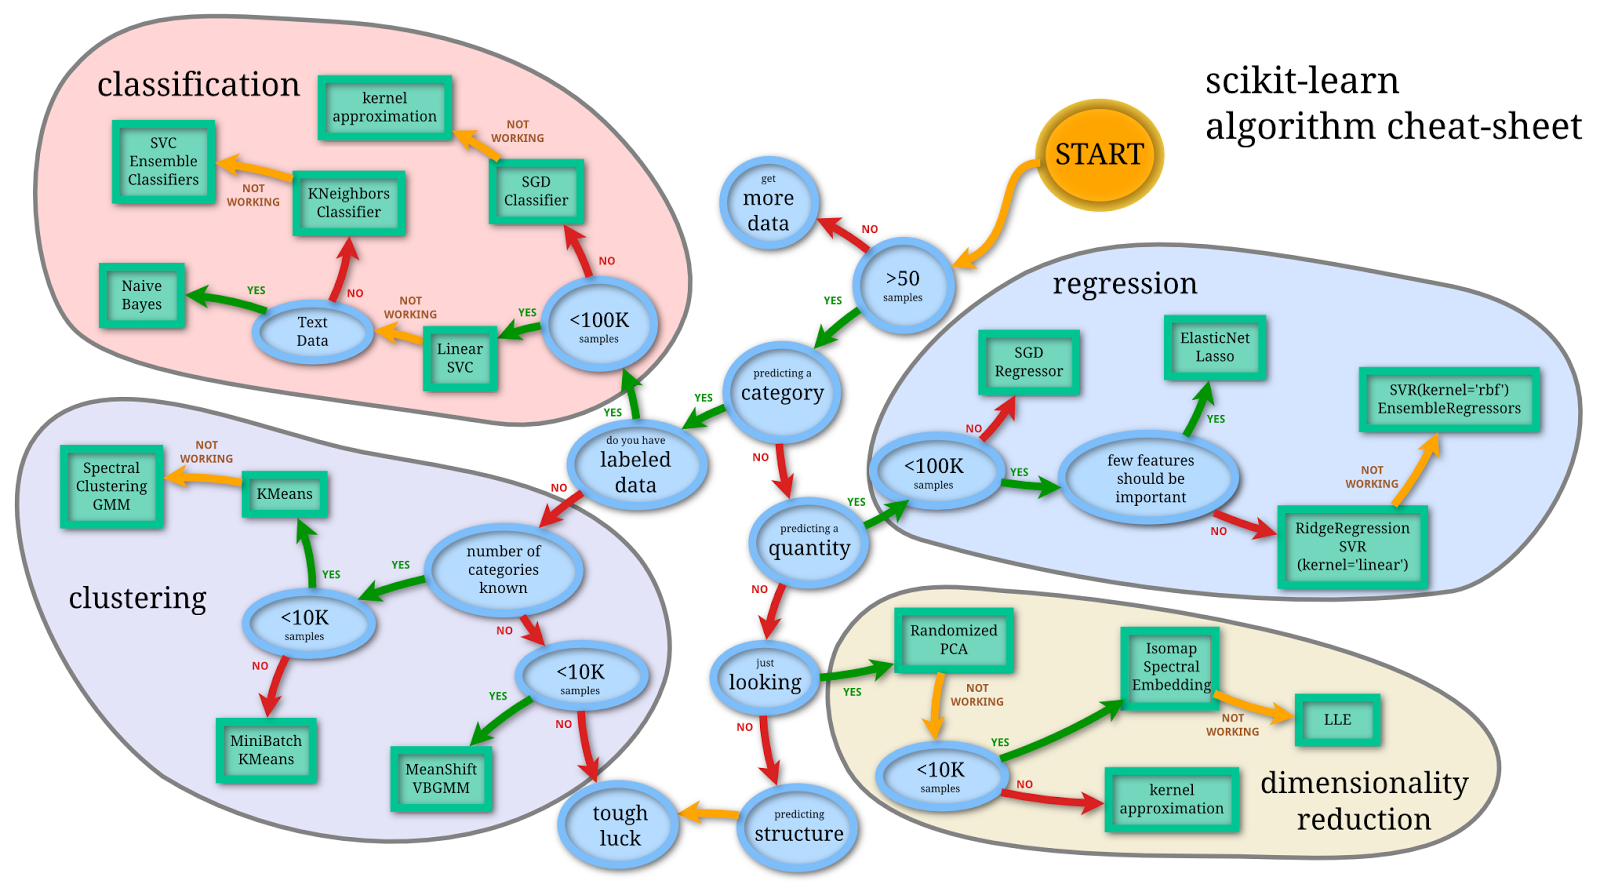
Andy Mueller (scikit-learn contributor) put together this cheat sheet a few months ago which is extremely helpful.


In [13]:
Image(url="http://1.bp.blogspot.com/-ME24ePzpzIM/UQLWTwurfXI/AAAAAAAAANw/W3EETIroA80/s1600/drop_shadows_background.png",
      width=700)


Out[13]:

Try building a linear regression model for the Boston Housing Dataset to predict Home Prices


In [13]:
from sklearn.datasets import load_boston
boston = load_boston()

Prep the data

  • Create a dataframe with the Boston data
  • snake_case/lower_case the columns
  • print to the console

In [34]:
import re


def camel_to_snake(column_name):
    """
    converts a string that is camelCase into snake_case
    Example:
        print camel_to_snake("javaLovesCamelCase")
        > java_loves_camel_case
    See Also:
        http://stackoverflow.com/questions/1175208/elegant-python-function-to-convert-camelcase-to-camel-case
    """
    s1 = re.sub('(.)([A-Z][a-z]+)', r'\1_\2', column_name)
    return re.sub('([a-z0-9])([A-Z])', r'\1_\2', s1).lower()

df = pd.DataFrame(boston.data)
df.columns = [camel_to_snake(col) for col in boston.feature_names[:-1]]
# add in prices
df['price'] = boston.target
print len(df)==506
df.head()


True
/usr/local/lib/python2.7/site-packages/pandas/core/config.py:570: DeprecationWarning: height has been deprecated.

  warnings.warn(d.msg, DeprecationWarning)
/usr/local/lib/python2.7/site-packages/pandas/core/config.py:570: DeprecationWarning: height has been deprecated.

  warnings.warn(d.msg, DeprecationWarning)
/usr/local/lib/python2.7/site-packages/pandas/core/config.py:570: DeprecationWarning: height has been deprecated.

  warnings.warn(d.msg, DeprecationWarning)
Out[34]:
crim zn indus chas nox rm age dis rad tax ptratio b lstat price
0 0.00632 18 2.31 0 0.538 6.575 65.2 4.0900 1 296 15.3 396.90 4.98 24.0
1 0.02731 0 7.07 0 0.469 6.421 78.9 4.9671 2 242 17.8 396.90 9.14 21.6
2 0.02729 0 7.07 0 0.469 7.185 61.1 4.9671 2 242 17.8 392.83 4.03 34.7
3 0.03237 0 2.18 0 0.458 6.998 45.8 6.0622 3 222 18.7 394.63 2.94 33.4
4 0.06905 0 2.18 0 0.458 7.147 54.2 6.0622 3 222 18.7 396.90 5.33 36.2

Fit your model

  • define your features
  • create a LinearRegression
  • fit the model

In [37]:
from sklearn.linear_model import LinearRegression

features = ['age', 'lstat', 'tax']
lm = LinearRegression()
lm.fit(df[features], df.price)


Out[37]:
LinearRegression(copy_X=True, fit_intercept=True, normalize=False)

Plot the predicted values against the actual values


In [38]:
# add your actual vs. predicted points
pl.scatter(df.price, lm.predict(df[features]))
# add the line of perfect fit
straight_line = np.arange(0, 60)
pl.plot(straight_line, straight_line)
pl.title("Fitted Values")


Out[38]:
<matplotlib.text.Text at 0x112ee6050>

Redo the model, but this time have a training/test set.

We just did the following

  • Learned about scikit-learn and what it's used for
  • Used CART to build a decision tree classifier and visualized it
  • Built a regression model using scikit-learn

In [ ]: